Thursday, November 6, 2014

Do’s and Don’ts: Use the 30 Second Report

Reports, Views, Tables and Visual Reports all give you great options for communicating project information. They also require time to explore and configure. But there is one reporting tool within Microsoft Project designed to give you on-demand status, that requires no configuration and that’s perfect for keeping historical information.

In this blog posting I will show you Project Statistics and how to use it in making a project journal — a readable, visual history of progress and of learning. Find Project Statistics by first selecting the Project tab from the Ribbon, and then Project Information. At the bottom of Project Information, click on the Statistics button. This action brings up Project Statistics for your review. Please note that this information is the current status of your Project file. (See figure below. Click on it to expand.)

image

Note how much information is listed! While small, this dialog box is packed with information you need to know, particularly if you’re evaluating progress or documenting the evolution of the project. Pasting this information into a word processor prior to entering updates and then again after making updates allows you to easily compare them and evaluate the differences.

To copy Project Statistics into your word processor, you must first copy it onto Windows Clipboard. You copy the dialog box onto the Clipboard by first ensuring Project Statistics is the active window, then by pressing Alt-Print Screen on your keyboard. Paste the data into the word processor with Ctrl-V.

Once the Project Statistics are in your word processor, you can make comments explaining the difference.

I recommend you try this 30-second reporting technique for a new perspective on project documentation. It allows you to easily create and keep a visual running history of your project.


Did you enjoy this blog post? If so, please let me know! I love to hear from my readers.

Sunday, October 19, 2014

Do’s and Don’ts: Use Task Paths!

A common characteristic of project schedules is the use of multiple predecessors in task sequencing. The general rule of thumb is that the latest predecessor’s dates drive the successor’s. Finding which predecessor that is can be a time consuming bit of analysis.

Project 2013 has made this much easier with a new feature: Task Path. Using Task Path, a you can select any task in the task list and find out which tasks are driving its schedule dates. Found in the Format tab, Task Path uses a different bar color format to identify Driving Predecessors. See the figure below for finer details. Click on the figure to enlarge.

TP1

Task Paths also dynamically change when the driving predecessor changes. In the figure below the driving predecessor has changed, and so the formatting moved to the new driving predecessor.

TP2

Dynamic, accurate and visible, the Task Path is worth a look. Let it help analyze the schedule!


If you enjoyed this blog entry, please consider attending my free webinar  “What’s New in Project 2013”. Register for it  HERE.  Hurry! Seats fill quickly.

Tuesday, September 23, 2014

Do’s and Don’ts: Do Create a Risk Assessment Dashboard (Part Two)

In Part One I presented a simple method to identify, quantify and evaluate risk in projects and tasks. In this blog entry I will create a “Risk Assessment Dashboard” in MS Project that's based on that method.

When completed it will look like this: (click on images to expand)

image

I will create the “Risk Assessment Dashboard” in four steps:

Step 1: Create the “Risk Assessment” table

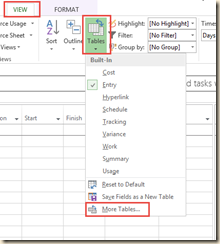
1) Click on the “View” tab.

2) In the “Data” group, click on “Tables”.

3) At the bottom of the “Tables” list click on “More Tables…”
image

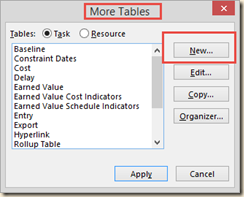
4) The “More Tables” dialog appears. Click on the “New…” button.
image

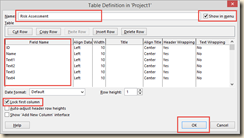
5) The “Table Definition” dialog appears. Enter data into this as is indicated in the figure below, then click on “OK”.
image

When a new table is created, Project places the table at the top of the table list so it is easy to apply. See the figure below.
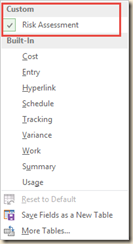
image

Now on to the next step.

Step 2: Create the two custom field lookup tables

1) Click on the “Project” tab.

2) In the “Properties” group, click on “Custom Fields”.

3) The “Custom Fields” dialog appears. The “Text1” field needs a name more descriptive of its function. Select “Text1” from the field list in the dialog and then click on the “Rename” button just under the list.

4) The “Rename Field” dialog appears. Rename the field “Probability(1…5) as is shown in the figure below.
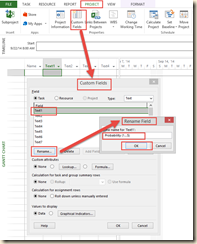
image

5) Click on the “OK” button in the “Rename Field” dialog to return to the “Custom Fields” dialog.

6) In the “Custom Attributes” section of the “Custom Fields” dialog, click on the “Lookup…” button.

7) The “Edit Lookup Table for Probability (1…5)” dialog will appear. This dialog will contain the levels of probability and what they mean. Enter the levels as shown in the figure below.
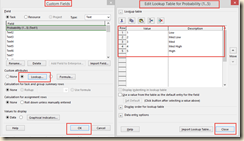
image

8) Click on the “Close” button in the lower right corner of the dialog. This returns you to the “Custom Fields” dialog.

9) Click on “OK” to close the dialog.

10) Note that the “Text1” field is now ”Probability (1…5)” and that every cell in the field contains a drop down listing of the levels of probability and what the number means. Project will still maintain the original field name as well as the new name.
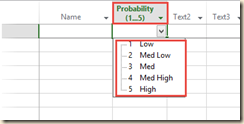
image

11) Repeat 1 through 9 for the “Text2” field, but rename it “Impact (1…5)”.  Once both fields are created, it’s  on to the next step.

Step 3: Create two formula fields

The “Text3” and “Text4” fields do the math and quantify the risk for the graphical indicators. Each will have to be customized.

1) For the “Text3” field follow steps 1 – 5, but give the field the new name “Risk Level (Prob X Impact, Max = 25)”.

2) In the “Custom Fields” dialog, in the “Custom Attributes” section, click on “Formula…”.

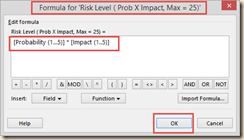
3) The formula editor will appear for the new “Risk Level…” field. Enter this formula (without the quotes): “[Probability (1...5)] * [Impact (1..5)]”. Alternatively, the editor contains MS Project’s fields for selection and inclusion in the formula. It now should look like the figure below.
image

4) Click on “OK” to set the formula, and click on “OK” in the “Custom Fields” dialog to set the field customizations. If the field returns “#ERROR”, it is because there is no data to evaluate yet. Test the field and results by choosing the value “2” from the two custom field lookup table. The result should be “4”.

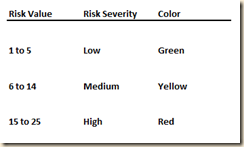
5) Repeat 1 – 2 above, but rename “Text4” to “Risk Severity”. This field will contain a formula that associates the risk to a High, Medium or Low threat. The field will evaluate per the rules in the table below.
image

6) Repeat 3 above with the formula “IIf([Text3]>14,"High",IIf([Text3]>5 And [Text3]<14,"Medium","Low"))”. Note that I used the actual field name in this formula. I could have used the new names instead. Both are valid.

The final step will associate the graphical indicators with “Risk Severity”.

Step 4: Create graphical Indicators

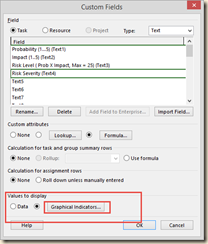
1) Return to the “Risk Severity” fields’ “Custom Field” dialog.

2) Near the bottom of the dialog, in the “Values to display” section, click on “Graphical Indicators” as shown in the figure below.
image

3) The “Graphical Indicators” dialog appears.  The goal is to have an indicator for “Low”, “Medium” and “High”. This will associate the correct color to each risk level. The figure below illustrates the syntax and selections you should make. image
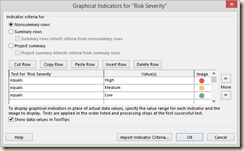
4) Click “OK” to set and close the “Graphical Indicators” dialog. Click on “OK” again to set and close the “Custom Field” dialog.

Test the new table out by entering a few tasks and using the probability and impact fields to associate different levels of risk. It should give you information similar to the figure below.

image

Once the work is done to create the “Risk Assessment Dashboard” edit the graphical indicators to work in Summary tasks and in the Project Summary Task. This action will enable you to represent and manage risk at any level in your project!

In the next blog entry I will use the fields, the formulae and the graphical indicators from this blog entry to report on risk. I will illustrate filtering and grouping risk and how to summarize the cost. work and schedule that is developed in the project so far.


Did you enjoy this blog post? If so, please let me know! I love to hear from my readers.

Friday, August 15, 2014

Do’s and Don’ts: Do Create a Risk Assessment Dashboard (Part One)

You know that MS Project is a great scheduling tool. Did you also know that it can help you quantify and evaluate risk?

In this post I will provide you with the basics for a simple risk evaluation tool. Then, in the next blog entry, I will build a Risk Assessment Dashboard in MS Project.

Risk severity is usually expressed in terms of probability and impact to a task or a project’s product, schedule, work or cost. When used to mathematically indicate risk severity, the formula is:

Risk Severity = Probability X Impact

The grid below is a model to group and evaluate task and project risk. Risks are represented on a scale of 1 (low) to 25 (high) and are the result of the severity formula.

image

In this simplified model I arbitrarily identified and grouped risks according to the following rules:

image

Naturally, your organization would need to decide on the value range representing high, medium and low risk.

The purpose of evaluating the risk is to determine if any action is needed to mitigate or retire the risk. In my model, low risks are only monitored. Medium risks are monitored and a mitigation plan created but not executed. A high risk receives action for retirement.

Risk assessments range from simple spreadsheets such as my example to complicated programs creating statistical forecasts and representative graphics. The key is that you have a tool that is useful and usable for you in the management of risks.

In the next blog post I will outline the steps to create a Risk Assessment Dashboard. It looks like the figure below and will provide at a glance the rules, mathematical formulae and graphics to alert you to the state of risk in your project.

image

(Click on the figure above to enlarge)


Did you enjoy this blog post? If so, please let me know! I love to hear from my readers.

Tuesday, July 8, 2014

Do’s and Don’ts: Discover Macros! (Part 2)

In my previous blog entry I illustrated how to record a macro. In this blog entry I will show how to connect the macro to a button in the Ribbon. It will look similar to the illustration below. (Click on the figures to enlarge.)

image

Here’s how to do it:

1. Ensure you are in the file containing the macro to link to a button.

2. Ribbon customizations are made in the “File” tab, in “Options” as is shown in the figure below.

image

3. Create a place to store and access your new button. In the “Main Tabs” list on the right side of the “Customize Ribbon” Options, choose the “View” tab and the “Macros” group as is shown in the figure below. Customizations are stored in a custom group, so click on the “New Group” button at the bottom right of the dialog.

image

4. The new group is created title “New Group (Custom)”. Click on the  “Rename…” button to bring up the “Rename” dialog as seen below. From this dialog, select the icon you wish for the button and rename it “Custom Macros”. Click on “OK”.

image

5. Insert your macro into your new group. From the “Choose commands from” list on the left, choose “Macros”. Your macro should be listed. Click on the macro on the left side, then click on your new group. Copy the macro by clicking on the “Add>>” button between the lists. The macro and the icon selected should now appear in the “Custom Macros” group as seen below.

image

6. Click on “OK” and admire your new custom button! Test it by clicking on it and view the results. If you are using the macro from the last blog entry, your project should now be formatted to show your Critical Path in formatted text and Gantt bars. See the final results below.

image

My next blog entry will help you take your analysis skills to the next level. We will create custom risk analysis columns and create a Risk Assessment Dashboard!  Stay tuned…


If you enjoyed this blog entry, please let me know. If it was informative – then consider training! My training offerings can be found HERE.

Tuesday, June 3, 2014

Do’s and Don’ts: Discover Macros!

Common work such as font selection and formatting take time that you probably don’t have. Why not let Project do this work for you? All you have to do is record a Macro. You don’t have to be a programmer to automate away repetition!
This blog entry will walk you through the steps of recording a reusable Macro that formats Critical Gantt bars and task descriptions red. After running the Macro all current and future critical tasks will be immediately identifiable!
Here is what it will look like (Click on figure to enlarge):
Formatted For Critical
Please note that I am using Project Professional 2013 in this example, though the same general steps may be followed in Project Professional 2010.


If you use Project in an enterprise environment or use Project Server, check with your administrative staff prior to creating and using this Macro.


Here are the steps:

A. Start recording the Macro:
1. Select the “View” tab.
2. Select the “Macros” button in the “Macros” group.
3. Choose “Record Macro…” from the drop down list.
Use the figure below to find the selection locations. (Click on figure to enlarge.)
1
4. Give the Macro a name:
The “Record Macro” dialog is presented for your entry of its Name and Shortcut key if you desire one. I named this example “Format_Critical_Tasks” so that I know what it does. (See figure below for details.)
2
Once you click on “OK” the Macro begins to record.

B. Format the Gantt Bars:
1. Select the “Format” tab.
2. In the “Bar Styles” group, check the “Critical Tasks” check box.
Use the figure below to find the selection locations. (Click on figure to enlarge.)
3

C. Format Critical Path Text:
1. Select the “Format” tab and select “Text Styles” from the “Format” group.
2. This will bring up the “Text Styles” dialog. Make these entries:
a. Click in “Item to change:” and choose “Critical Tasks” from the drop down list.
b. Click in “Color:” and choose red.
c. Click on “OK” to apply your changes.
Use the figure below to find the selection locations. (Click on figure to enlarge.)
5
The reward for your actions is that the Critical Path tasks are now literally popping from the page! It should now correlate the Critical Bars and Text so that they are obvious. See figure below. (Click on figure to enlarge.)
6

D. Stop the Macro
1. Select the “View” tab.
Select the “Macros” button from the “ Macros” group.
3. Choose “Stop Macro” from the drop down list. Use the figure below to find the selection locations. (Click on figure to enlarge.)
7

The Macro can now be run on any file by returning to the Macro list, choosing the Macro and clicking on the Run button as shown below.
8

There you have it –a reusable Macro identifying the Critical Path! As the data in your project changes, the formatting will change to reflect the new Critical Path.

My next blog entry will help you take your Macro to the next level – Assigning it to a button! Stay tuned…


If you enjoyed this blog entry, please let me know. If it was informative – then consider training! My training offerings can be found HERE.

Tuesday, February 25, 2014

The Trouble With Deadlines

Deadlines seem to exist in every project. How do you depict them? Are they constraints? Are they impacting your schedule? Do you have an early warning system that informs you they are not being met?
Project’s Deadline feature can help depict the deadline and provide warnings when the deadline is surpassed. When utilized it provides a visible clue that a task should complete on or before the date represented. If the deadline date is surpassed, a warning appears in the task’s Indicators field alerting you to the conflict. In the figure below, note the Deadline date and that one task has exceeded its Deadline, resulting in a warning. (Click on the figure to enlarge.)
clip_image002
Unfortunately Project also will define the errant task as Critical, even if it is not on the Critical Path. This can be a problem if Critical Path Analysis is important to your organization as an argument can be made that the Deadline driven schedule and Critical Path Methodology are mutually exclusive techniques. If you require deadlines and still need your critical path, you may want to abandon deadlines and constraints for the concepts of “Due Dates” and “Due Date Dashboards”.
“Due Dates” involve customizing a table with 3 new formula and date driven fields with graphical indicators and creating a milestone type Gantt bar representing the due date in the Gantt Chart. In the figure below, I have highlighted the fields and graphics to illustrate the appearance of “Due Dates” in the schedule prior to any task schedule slip.
clip_image004
The next figure illustrates the appearance when the schedule slips. Notice the graphical indicator has changed. This is indicating that the task finish and due date are approaching each other.
clip_image006
You can look at “Due Dates” in any fashion that you wish. The same project is shown below but now the “Current Date” and the “Due Date” are approaching each other. Again, the indicator changes to reflect the upcoming date conflict.
clip_image008
Here are the steps to create a “Due Date Dashboard” such as the one in the figures above:
1. I created the “Due Date” field. I chose to use the “Finish1” field and renamed it “Due Date”. I then inserted the field into a table.
clip_image009
2. I created the “Status: Due Date From Finish” from the “Text1” field, inserted the field and then gave it a custom formula and graphical indicators. I first check to see if a “Due Date” exists. If it doesn’t, the result in the field is “N/A” and a dash will be shown as a graphic indicator. If a “Due Date” has been entered, I check to see if the task finish date is within a 3 day buffer. If it is not within the buffer, the result is “Green” and a Green Ball will be shown. If the “Due Date” is within the buffer, it is “Red” and a Red Ball will be shown. See the figures below for details.
clip_image010
clip_image011
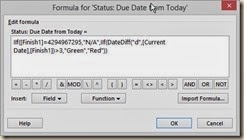
3. The “Status: Due Date From Today” field was created from the “Text2” field and is generally the same as the previous example, only using the “Current Date” instead of the task finish date in the formula. The figure below contains the specifics.
clip_image012
clip_image013
4. The final step is to create a Bar Style to represent the new “Due Date”. Using the Format tab, I chose Format…Bar Styles to enter the dialog for formatting existing bars or creating new bars. Note that since only one date is depicted as a “Due Date” that the bar is drawn from and to the “Due Date”.
clip_image015
If you can keep your project current, “Due Dates” and the “Due Date Dashboard” can give you early warning on schedule slips and their impact to the project.

If you connect to Project Server, Project Online or other enterprise system, please coordinate with the administrator prior to implementing this or any technique using custom fields!

Did you enjoy this blog entry? Do you have a question about it? If so, send me a line, will you? Thanks!