Tuesday, June 16, 2020

Microsoft Project Do’s and Don’ts – Identifying Early and Future Task Tracking!

Have you ever started or completed work in the future? When you think about it, this ability could cause you some problems. Would your cost and work reports be skewed? Would resource availability be a problem? Are task dependencies still valid? Is the original schedule still viable? The list goes on and on. Given the potential problems, what would be a good reason to track progress now for work to be started or completed in the future?

I can think of two reasons immediately, but there are probably more:

1. “What If Analysis”- Imposing progress on future work gives you a “free” look at expected work and cost expenditures at specific date and data points. You could then evaluate if the schedule is realistic or if re-planning is required. You probably don’t want to set a baseline until you are more comfortable with the schedule.

2. The progress was entered by mistake – Many users take status by using the %Complete buttons. Often these very alluring buttons are used without considering the planned start and finish dates. Even if the task started early the actual start date would be different than the planned start date.

In the absence of other tracking data setting a %Complete on a future task forces Project to set the Actual Start date as the original Start date. Then the selected or entered %Complete is applied to the task. Project does this without alarms or messages. All of this happens easily and is surprisingly hard to detect.

If this sounds familiar to you, I have a troubleshooting tip for you! It’s a new column containing a formula and graphic indicator that looks at the current date for every task. If a task has an Actual Start Date in the future, a graphical indicator will catch your eye to get your attention.

There are many aids to help you track in Microsoft Project. Some are built-in and some are add-ins, but all are pretty useful and should be considered depending on your needs. Please check out MPUG’s list of vendors to see if any might work for you.

What follows is a custom solution that I used in instruction to emphasize data entry errors that may then create scheduling and tracking errors. This can be a problem in Agile or original waterfall designs. Both have dates associated with tasks and so are at risk to entry errors. If you are part of a larger organization or are using enterprise tools, check with your administrator to make sure they are not proprietary before trying out the techniques discussed in this document.

The simplified example project is shown below in the Tracking Gantt view and Tracking Table. It is Automatically scheduled in order to see entry results quickly. No resources are utilized as this example will focus on schedule only. There are only three tasks and they have a finish to start dependency. A baseline has been set, but no progress entered because the current date is before the project is planned to start. The planned and baselined start date of Task 1 is May 4, 2020. So far there are no issues with the model.

Figure A- Example Project Tracking Gantt View


Next, I set the current date to May 5th, and entered status on Task 1 and 2. Task 2 is a future task. If the task started early this is not the best technique to enter the early progress. This will be discussed later in this article.

Figure B- Example Project Tracking Gantt View after status. Note the absence of visual clues, warnings or error messages. Only the current date gridline gives a hint of the issue. 


Imagine how difficult identifying this would be if there were hundreds of tasks with only a few tasks being tracked in the future! You need an indicator to help you do any troubleshooting on this error. The final result should look something like this:

Figure C- Example Project Tracking Gantt View with indicators noting tracking state.


Creating this very visible indicator requires only a formula in a text field, a graphical indicator representing the formula results and a little testing. For the purpose of this blog entry I chose the Text 1 field and did not rename it so you can identify it is indeed a text field. Then I entered a formula that looks at the current date and evaluates whether the task is being tracked in the future or not. It serves no other function – no looking for incomplete or late tasks, no cost or schedule comparisons to baseline. Its only purpose is to give you a starting point in customizing a specific tool for analysis and trouble shooting.

Figure D- Formula used for analyzing if a task is tracked in the future. Your formula may need to be modified for your version of Project.


Figure E- Assignment of graphical indicators to formula results. Note that summary tasks are not included. The Value(s) column explains the tracking state and the image associated with the result.


Figure F- The Problem with the future tracking is visible as indicated by the new custom field and indicators.


What if the task did start early and the task just needs to be edited? In Figure G, I changed the actual start of Task 2 to May 7, 2020. Project redrew the Gantt bar to illustrate that change. Note that the new finish date has modified the successor’s start date to a date earlier than the baseline start. The result is a small amount of schedule savings.

Figure G- The correction of actual start has an effect on schedule!


Obviously, this is a simple example. Real tasks involve resources, work, cost and other complications that you will have to keep in mind. Now you have a tool to help you troubleshooting for both early and future task tracking.

Once the column, formula, and indicators are in place, you can rename the field and can develop a group for it. In the next two screen shots I renamed the field to “Task Tracking State” and created a group with the same name.

Figure H- Text 1 field renamed “Task Tracking State”


Figure I- Group “Task Tracking State” created and applied.


Would you like to see this concept in action? Want more details on custom fields and groups? This is included in my MPUG webinar entitled “Microsoft Project Do’s, Don’ts and Cool Customizations” on June 24, 2020. It was recorded and is HERE if you wish to view it.

Thursday, November 14, 2019

Reposted by demand: Do’s and Don’ts: Use a Kanban Board!

Sometimes managers and executives want to know only the basic status of a task or project. Questions like “Has it started?” or “Is it done?” are not calling for a detailed analysis of whether performance is going as planned. They are quick questions demanding a quick answer.
In this blog entry I am going to create a “Kanban Board” that gives at-a-glance answers to those basic questions. It looks like this in Project: (Click on figures to enlarge)
1
The “Kanban Board” clearly shows what is completed, what is in progress and what is not started. If your organization uses Agile techniques in managing projects, you will recognize the “Kanban Board” as a tool to help you and your management team manage workflow in projects.
The “Kanban” technique was originally imagined by Toyota to capture workflow. It can have more than the three states used in this example depending on need and preference. Conduct a web search on “Kanban” to get more details on this excellent technique.
In its simplest form, a“Kanban Board” look like this:
3
Note that the “Simple Kanban Board” and the “Kanban Board” shown in Project contain  similar information. The difference between the two  is that one is a formula-driven table in Microsoft Project while the other is yellow sticky notes. Both work, but by incorporating the Project table a complete schedule can be managed at any level during the project’s life cycle.
The “Kanban Board” avoids graphic details such as those found in the “Tracking Gantt”:
2
Note that the project file used for this blog entry is actually a small portfolio of projects organized by departments. For the sake of clarity dedicated resources from each department are assigned to their department’s projects. The Tracking Gantt gives detailed information regarding slipping tasks, performance to plan, variance and even illustrates the critical path. These are obviously important details, but are not the focus of the “Kanban Board.”
In order to create a “Kanban Board” in Microsoft Project a small amount of customization has to be done. A custom field, a custom view and a custom group all interrelate and give you this simple and effective tool.
The custom field should be an unused text field. This is critical! You will overwrite existing data if you choose a text field already in use.
Here are the steps to create a “Kanban Board:”
    1. Select the “Project” tab and then click on “Custom Fields.”
      2. Select an open text field, then click on the “Rename…” button to give the text field a unique name. I chose “Kanban Board” for consistency.
        4
          3. Click on the “Formula…” button to enter the formula that will control the Kanban Board. Enter the formula as shown in the figure below. You may have to adjust the formula for your specific system. For example, some systems require a single quote rather than the double quote.
            5
              4. Once the formula is entered, select “OK.” You now have the custom field needed for the “Kanban Board.”
                5. Insert your new “Kanban Board” field into the table of your choice. Once inserted, the formula should populate the field indicating their completion state.
                  5a
                  6. Prepare a Group to organize the project by completion state. Select the “View” tab then from the “Group by:” dropdown list choose “New Group By…” and enter the information below into the Group Definition dialog.
                  7. Click on the “Save” button to save your new custom group.
                  6
                  8. Create a new View to use the new field and group. Select the “View” tab and from the list of “Task Views” click on “More Views…”
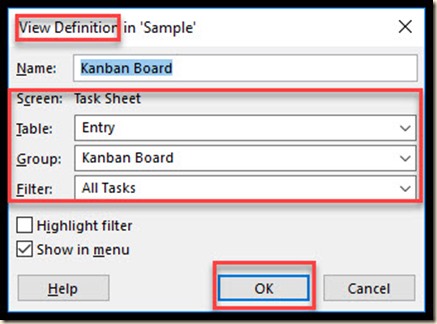
                  9. Enter the information below into the new View Definition dialog.
                  7
                  10. Finally, test your new view by selecting the “Task” tab, then selecting your “Kanban Board” from the list of custom task views. It should look similar to the figure below.
                  8
                  If you wish to create a report based on the view, simply create a new table report using the “New Report” wizard in the “Report” tab and apply the “Kanban Board” group in the report’s Field List. Show all tasks in the outline level and you have the complete tool in Project. Congratulations! In ten steps you have created a custom field containing a formula, a custom Group and a custom View to show off your new “Kanban Board.”

                  Tuesday, April 2, 2019

                  Microsoft® Project Do's and Don'ts made it to the Best Microsoft Project eBooks of All Time and list of Best New Project Management Books!


                  I'm happy to announce that my book, "Microsoft® Project Do's and Don'ts: The definitive guide to jumpstart your project (MPUG Essentials Series)", made it to BookAuthority's Best Microsoft Project eBooks of All Time and also BookAuthority's list of Best New Project Management Books.

                  BookAuthority collects and ranks the best books in the world, and it is a great honor to get this kind of recognition. Thank you for all your support!

                  The book is available for purchase on the Microsoft Project User Group's website.


                  Sunday, October 7, 2018

                  The updated Microsoft Project Do's and Don'ts has arrived!


                  It took a while, but it's finally here. I have updated Microsoft Project Do's and Don'ts for those of you who have asked for more.It now includes a chapter introducing Agile tools in Project and how to create KanBan Boards to aid in work flow and reporting. The book can also be purchased in a bundle with a workbook, exercises, sample files and how-to videos. Entitled the Microsoft Do's and Don'ts Bootcamp, it is priced right and ready for you here:

                  https://www.mpug.com/do/

                  As always, feedback is appreciated. Enjoy and thank you for your support!

                  Saturday, May 19, 2018

                  Do’s and Don’ts: Use a Kanban Board!

                  Sometimes managers and executives want to know only the basic status of a task or project. Questions like “Has it started?” or “Is it done?” are not calling for a detailed analysis of whether performance is going as planned. They are quick questions demanding a quick answer.
                  In this blog entry I am going to create a “Kanban Board” that gives at-a-glance answers to those basic questions. It looks like this in Project: (Click on figures to enlarge)
                  1
                  The “Kanban Board” clearly shows what is completed, what is in progress and what is not started. If your organization uses Agile techniques in managing projects, you will recognize the “Kanban Board” as a tool to help you and your management team manage workflow in projects.
                  The “Kanban” technique was originally imagined by Toyota to capture workflow. It can have more than the three states used in this example depending on need and preference. Conduct a web search on “Kanban” to get more details on this excellent technique.
                  In its simplest form, a“Kanban Board” look like this:
                  3
                  Note that the “Simple Kanban Board” and the “Kanban Board” shown in Project contain  similar information. The difference between the two  is that one is a formula-driven table in Microsoft Project while the other is yellow sticky notes. Both work, but by incorporating the Project table a complete schedule can be managed at any level during the project’s life cycle.
                  The “Kanban Board” avoids graphic details such as those found in the “Tracking Gantt”:
                  2
                  Note that the project file used for this blog entry is actually a small portfolio of projects organized by departments. For the sake of clarity dedicated resources from each department are assigned to their department’s projects. The Tracking Gantt gives detailed information regarding slipping tasks, performance to plan, variance and even illustrates the critical path. These are obviously important details, but are not the focus of the “Kanban Board.”
                  In order to create a “Kanban Board” in Microsoft Project a small amount of customization has to be done. A custom field, a custom view and a custom group all interrelate and give you this simple and effective tool.
                  The custom field should be an unused text field. This is critical! You will overwrite existing data if you choose a text field already in use.
                  Here are the steps to create a “Kanban Board:”
                    1. Select the “Project” tab and then click on “Custom Fields.”
                      2. Select an open text field, then click on the “Rename…” button to give the text field a unique name. I chose “Kanban Board” for consistency.
                        4
                          3. Click on the “Formula…” button to enter the formula that will control the Kanban Board. Enter the formula as shown in the figure below. You may have to adjust the formula for your specific system. For example, some systems require a single quote rather than the double quote.
                            5
                              4. Once the formula is entered, select “OK.” You now have the custom field needed for the “Kanban Board.”
                                5. Insert your new “Kanban Board” field into the table of your choice. Once inserted, the formula should populate the field indicating their completion state.
                                  5a
                                  6. Prepare a Group to organize the project by completion state. Select the “View” tab then from the “Group by:” dropdown list choose “New Group By…” and enter the information below into the Group Definition dialog.
                                  7. Click on the “Save” button to save your new custom group.
                                  6
                                  8. Create a new View to use the new field and group. Select the “View” tab and from the list of “Task Views” click on “More Views…”
                                  9. Enter the information below into the new View Definition dialog.
                                  7
                                  10. Finally, test your new view by selecting the “Task” tab, then selecting your “Kanban Board” from the list of custom task views. It should look similar to the figure below.
                                  8
                                  If you wish to create a report based on the view, simply create a new table report using the “New Report” wizard in the “Report” tab and apply the “Kanban Board” group in the report’s Field List. Show all tasks in the outline level and you have the complete tool in Project. Congratulations! In ten steps you have created a custom field containing a formula, a custom Group and a custom View to show off your new “Kanban Board.”

                                  Friday, April 13, 2018

                                  Calendar and Timescale Disconnects

                                  In my April 4th webinar “Set Up For Success” I explained and demonstrated 6 setup mistakes I have seen that can result in questionable schedules. One of those mistakes is failing to ensure that the calendar set for the project is represented in the Gantt Chart’s Timescale. This blog entry will help you find and correct that disconnect.

                                  My assumption here is that you spent the time necessary to edit your project calendar. If not, you should have! Calendar exceptions (non-work days) are major factors in determining the finish dates of tasks and projects. Calendar exceptions are made in the Change Working Time dialog found on the Project tab on the Ribbon.

                                  1. The Change Working Time Dialog

                                  3

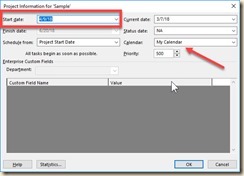
                                  Once the Project Calendar is edited, the calendar is set in the Project Information dialog found on the Project tab on the Ribbon.

                                  2. The Project Information Dialog

                                  1

                                  When you have edited the Project Calendar and set it, MS Project will use the set calendar for calculations. Now the Gantt timescale needs to know which calendar to represent to the User. Double click in the Gantt timescale to bring up the Timescale dialog. Click on the Non-working time tab from the dialog and check the Calendar setting. If the incorrect calendar is set, change it to use the Project Calendar you set in the Project Information dialog. Now the project calendar used in schedule calculations can be viewed in the Gantt Timescale.

                                  3. The Timescale Dialog

                                  2

                                  These helpful hints and more can be found in my book Microsoft Project Do’s and Don’ts. It is portable, brief and to the point so you can find help when you need it. Through tips, best practices and examples it will help you jumpstart your project!

                                  D&D

                                  The Microsoft Project User Group published it for purchase HERE.

                                  It is also available in Kindle and Paperback on Amazon HERE.

                                  Thursday, March 22, 2018

                                  April 4 Webinar: Three Questions to Ask Before Entering Data in Microsoft Project


                                  Microsoft® Project for Windows has been available for nearly 30 years. Users still think that it’s like Excel and begin entering data immediately after opening a new file. This action is allowed in Project but I don’t recommend it as a standard practice. Here are three questions you should answer before entering data, and why getting the answer is so important:
                                  • Do you know the project start date? If not, entering a date earlier will either generate error messages or skew the date calculations.
                                  • Is your project calendar up to date? Using incorrect calendar dates may show erroneous schedule, work and cost distribution information in the project. It’s vital to understand cash flow!
                                  • Do you understand the hierarchy of calendars? In your project, which calendar will win in a conflict? Not knowing the answer may affect work and cost distribution.
                                  These and other set up questions will be discussed in my upcoming webinar on April 4thentitled “Microsoft® Project Do’s and Don’ts: Set Up for Success”.

                                  Just one more thing...
                                  My newest book Microsoft® Project Do's and Don'ts is now available for purchase! You can order it HERE.

                                  It is portable, brief and to the point so you can find help when you need it. Through tips, best practices and examples it will help you jumpstart your project!


                                  Tuesday, March 13, 2018

                                  Managing Negative Slack: Dos and Don’ts

                                  Much has been written about Critical Path, Slack, Constraints, and the various forms of Duration and Dependencies. But, have you looked for Negative Slack? This is generally defined as the amount of time required to complete a task or project beyond its scheduled finish date. Think of it as the minimum amount of time to be made up in a schedule if it is to finish on time.

                                  The causes of Negative Slack are the usual suspects named above: constraints, deadlines, dependencies, duration increases, and any number of errors in schedule assumptions. Unfortunately, these are also common characteristics found in most projects.

                                  What tools do we have in Microsoft Project to help identify Negative Slack, so we can manage it?

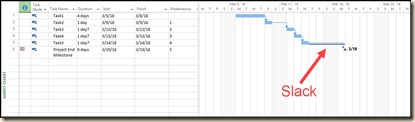
                                  The figures below have been designed to illustrate the Negative Slack concept. In Figure 1, all tasks and a constrained finish milestones are linked with finish-to-start dependencies. The milestone’s Must Finish Date constraint is far enough into the future that it imposes three days of Total Slack (Float) into the schedule. Additionally, the Critical Tasks and Slack check boxes in Format Tab > Bar Styles are checked. This means that Slack will show in the schedule and Critical Tasks will be formatted to red. Since there are three days of Slack, none of the tasks are Critical. Note: there are settings in Project that allow you to format tasks as Critical when the Slack is more than the default days, but this is a complexity not required for this discussion about Negative Slack.

                                  Figure 1

                                  Figure 1

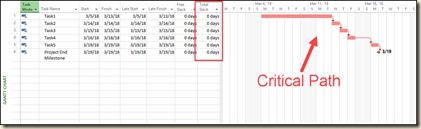
                                  Now, let’s use the Schedule Table to show Slack calculations (View tab > Tables > Schedule). You will see that the duration of the first task has been increased to seven days in the figure below. This reduces the Total Slack to 0 days, and the Critical Path then emerges. You know what this means. Any more increases in duration and the project finish date will be missed!

                                  Figure 2

                                  Figure 2

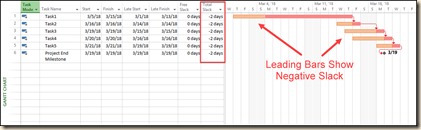
                                  Now we’ll add an additional duration of 2 days to Task1. Notice in Figure 3 that the values in the Total Slack column are negative. If you examine the relationship of the finishing milestone to Task5, you will see the effect of the constraint. Project honors the sequence of Tasks 1-5, and the relationship between Task5 and the finishing milestone is ignored to allow for the increase in duration of Task1. The result is Negative Slack, and now you can see it in the schedule.

                                  Figure 3

                                  Figure 3

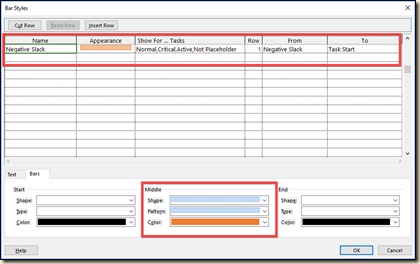
                                  You can’t manage what you can’t see. In Project, you can create a Negative Slack bar in your Gantt chart by adding it to Bar Styles. Figure 4 below indicates what to enter into the bottom of the Bar Styles dialog (first blank line). You bring this up for editing by clicking the Format Tab > Format button > Bar Styles. The color and density of the bar is arbitrary. Every other item should be entered as defined in the dialog. Don’t forget to click OK when the entries are complete.

                                  Figure 4

                                  Figure 4

                                  So, you understand what caused the problem.

                                  Now that you can identify Negative Slack in the schedule, you should be able to manage it. The responses and corrections made by the Project Manager should directly correspond with the amount and severity of the Negative Slack.

                                  What possible solutions are available to get back on track?

                                  Although not a complete list, here are some ideas to guide course correction:

                                  1. Break long tasks into shorter tasks where possible.
                                  2. Ask for more resources to be assigned on tasks where effort drives duration. This could shorten task duration, which could be effective for Critical and Negative Slack tasks.
                                  3. Examine dependencies. Can sequential tasks have some overlap or run parallel to others? If Lag is in the schedule, can you remove it? What effect does it have?
                                  4. Examine constrained tasks. Can you use partial constraints and not absolute constraints, such as “Must Start On”?
                                  5. Reduce Scope. Are any tasks on the schedule there only arbitrarily? Can you eliminate them?
                                  6. Consider asking for an extension of the project deadline.

                                  Obviously, some items on this list may not be possible, but you can use it to build your own course of action to get the project “back in the black.”

                                  Want more Do’s and Don’ts? Check out my new book: Microsoft® Project Do’s and Don’ts!

                                  Monday, October 2, 2017

                                  Microsoft® Project Do's and Don'ts Now Available!


                                  The softcover version of my newest book Microsoft® Project Do's and Don'ts is now available for purchase! You can order it HERE.

                                  It is portable, brief and to the point so you can find help when you need it. Through tips, best practices and examples it will help you jumpstart your project! 

                                  Wednesday, March 1, 2017

                                  Do’s and Don’ts: Use a Combination View to Ease Problem Solving

                                  You have probably noticed that some of the most powerful views in Project have an upper part and a lower part. These two part views are called Combination Views. The upper part is called the Primary. It is for identifying a single component such as a resource or a task. The bottom part is called the Details. It is to provide more information about what is selected in the Primary. A great example in every version of Project is the “Task Entry” View shown below. (Click on Figures to expand.)

                                  1

                                  The “Task Entry” View is comprised of a “Gantt Chart” in the Primary and a “Task Form” in the Details. Select a task in the “Gantt Chart” and the “Task Form” tells you literally everything you need to know about the task including resources assigned and the work assigned to them, task predecessors, task type and whether the task is effort driven or not. If you right click on the “Task Form”, Project will offer you a list of other Details available such as “Work”, “Cost” and “Schedule”.

                                  Another great View to aid in resource leveling is the “Resource Allocation” View. “Resource Usage” View is the Primary and “Leveling Gantt” View is the Detail.

                                  2

                                  This Combination View is designed to highlight resource overallocations in the Primary and show any concurrent or overlapping task assignments in the Details.It’s a great start to understanding the impact of the schedule to your resource assignments.

                                  When you have solved unacceptable overallocations by using leveling techniques, the “Leveling Gantt” will illustrate the pre leveled and post leveled schedule for your analysis.

                                  You aren’t limited to the “canned” Combination Views. You can create your own!  Some great combinations are the “Resource Graph” over the “Gantt Chart”, “Gantt Chart” over the “Relationship Diagram” and “Resource Sheet” over the “Resource Graph”.

                                  If you’ve never created a Combination View, Project 2013 and 2016 Help has a great tutorial under “Split a view”. Other versions use similar language.

                                  Give Combination Views a try. You’ll save a little time analyzing and problem solving!

                                  Friday, December 30, 2016

                                  Get Your Project Overview in One Click

                                  Provided you have kept your MS Project 2010 – 2016 data file current, “Project Statistics” is the fastest project summary report that you have at your fingertips.
                                  How to get to the “Project Statistics” dialog is one of the questions most asked of me by frustrated users.
                                  Below is a screen shot of the “Project Statistics”of a project in a formative state. You can see the value of the information that is displayed in fields. (Click on any figure to enlarge.)
                                  1
                                  Most users want a button to click on to get to “Project Statistics”. Unfortunately, it’s not on the Ribbon, but is a sub-component of “Project Information”. This means changing to the “Project” tab, clicking on “Project Information” in the “Properties” group and finally clicking on “Statistics…” at the bottom of the “Project Information” dialog. Although easy to do, it’s a pain to have to leave your position in the MS Project interface to chase down the statistics.
                                  You can save time and frustration by placing a “Project Statistics”  button in your “Quick Access Toolbar”. Here is how to do it:
                                  The “Quick Access Toolbar” is on the upper left portion of the interface. On the right side of this toolbar is a dropdown. Click on it.
                                  2
                                  The drop down list offers you choices. Click on “More Commands…”
                                  3
                                  This will bring you to  “Customize the Quick Access Toolbar” in “Project Options”.
                                  From here there are only a few more steps:
                                  1. In the “Choose commands from:” list, click on “All Commands”.
                                  2. Find and click on “Project Statistics” in the list of commands.
                                  3. Move the command into the “Quick Access Toolbar” by clicking on the “ADD>>” button.
                                  4. Move the new command to where you want it in the list. Top to bottom in the list is left to right in the toolbar.
                                  5. Once it’s where you want it, click on the “OK” button.
                                  4
                                  Now you won’t have to lose your place in the Project interface just to find out the state of your project. That information is now only a click away.
                                  5
                                  Once you’ve tried this, try adding the “Scroll to Task” button or any other button you find yourself using frequently. It’s well worth the time to configure Project to meet your needs!

                                  Wednesday, October 5, 2016

                                  Do's and Don'ts: Use Hammock Tasks


                                  Every so often I am asked to reproduce a project management technique in MS Project that is not a named feature in the software. Such is the case in this blog entry regarding “hammock” tasks.

                                  A hammock task is a task that has a variable duration. The duration is controlled entirely by other tasks in another or the same project. The start and finish of the hammock is linked to the other tasks start or finish. The duration of the hammock is recalculated when the linking tasks change their dates.

                                  Opinions about hammock tasks range from “don’t do it!” to “always drive your level of effort tasks with the technique”. It’s easy to set up a hammock task but there are caveats that you need to know before using the technique in a production environment. I’ll cover some of those in this blog entry as well.

                                  A hammock task looks pretty inconspicuous:

                                  The task names point out their function. The start of the hammock is the paste linked start date from “Hammock Start Link” which I formatted in bold red. The finish of the hammock is the paste linked finish date from “Hammock Finish Link” formatted in bold green. Note the indicators in the lower right of the hammock tasks date cells. These indicators are visual markers telling us the dates are linked. 

                                  I will double the duration of task #2.  This forces a recalculation and the duration of the Hammock Task is changed to 6 days. The calculation may take a few seconds, even on a very fast machine, so be patient.

                                  Also note that this entire blog entry was made with Project Pro in Manual Schedule mode, with a resource assigned at half time. This worked well with a simple resource using the same calendar as the project and with no overallocations. It is very likely that I would have to manually resolve any task or resource scheduling issues in a more complicated project. This would be true regardless of the scheduling mode selected. 

                                  Now for some caveats:
                                  •  Hammock tasks can be confusing to anyone reading your schedule. So include a note restating the purpose of the task. For example, is it to collect a level of effort for management resources? Synchronizing the project with other tasks or projects in a program schedule?
                                  • Paste links can be lost easily, so visit the task and its position in your schedule often.
                                  • Since a hammock task receives its dates as a paste link, the task probably should not have a predecessor or successor. If it is necessary to link with other tasks, revisit your need for a hammock task. Maybe a normal task will meet your needs? 
                                  • Hammock tasks are schedule driven and not resource driven. Be cautious when leveling resources. You might consider making the task a higher priority than other tasks so Project will skip the task when leveling the rest of the project.
                                  There are always sequencing workarounds and alternatives, but the hammock task continues to be one of the primary tools used in scheduling. You can find more on this subject online and in MSDN. Use the term “hammock task” and you’ll get a great deal of information on the pros and cons of using a hammock task.